Currency Weekly Review: Euro Gained Support As Major Risks Are Mitigating
 DXY Index Price Chart: 5-minute Timeframe (from June 27 to July 4, 2018). Source: Tradeview.com
Concerns about slow boiling China-US trade war make traders in a holding pattern. The US Dollar was traded in a small range as market participation stay low before the July 4th holiday. US dollar becomes a beneficiary of risk-off trading sentiment and Chinese Yuan keeps depreciating as trade tension remains elevated. The market sentiment improved as the Chinese central bank pledged to keep the exchange rate “basically stable”, but the tension is growing with the approaching July 6th deadline when $34 billion of tariffs on Chinese export is due. The coming US ADP Private Employment report and the US ISM Non-Manufacturing Composite will provide confirmation for the future trend of this currency. It is expected that the increase in June private payrolls will be seen while the non-manufacturing index will fall, as a result of the uncertainty of supply and prices in non-manufacturing sector due to the escalating trade tensions.
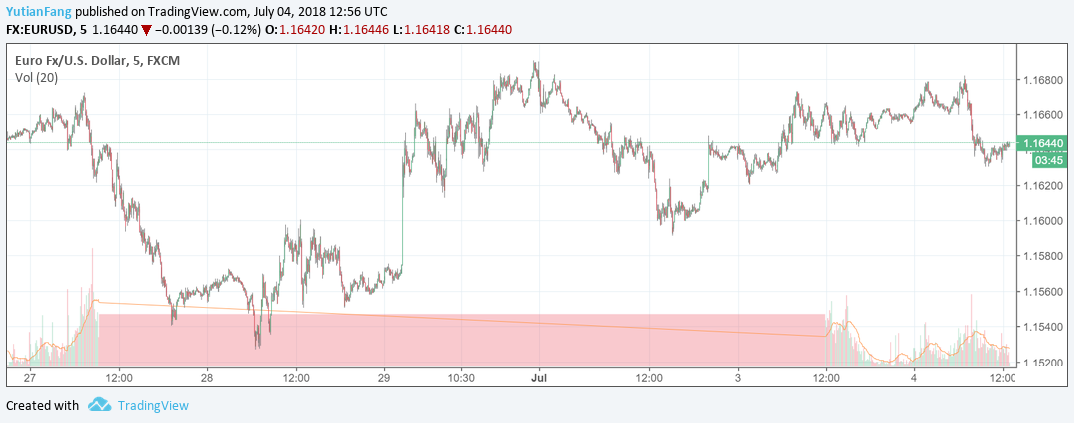 EUR/USD Price Chart: 5-minute Timeframe (from June 27 to July 4, 2018). Source: Tradeview.com
The Euro jumped more than a half cent after an agreement on migration has been reached by European Union leaders on last Friday. The single currency had slipped on Monday after German Interior Minister confirmed his offer to resign, threatening the government’s coalition partnership, but it steadied following Christian Social Union (CSU) party reached “tenable clear agreement” with Christian Democrats (CDU) over illegal immigration. The shake-up effect to the bloc from Italy is wearing off as the new Italian government seems to be trying to conform to European Union deficit rules. The Euro rose against dollar on July 3rd and closed at $1.1659. In the short term, concerns about US’s tariffs on imports from China remain a factor for investors to take neutral perspective on this pair.
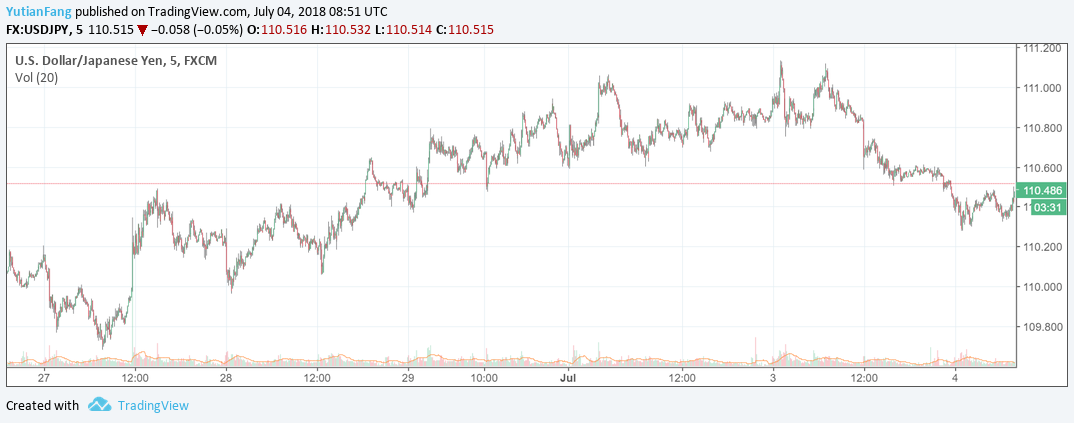 USD/JPY Price Chart: 5-minute Timeframe (from June 27 to July 4, 2018). Source: Tradeview.com
The USD/JPY pair kept climbing early this week and closed at 110.89 on July 2nd. The trade war would put threat on Japanese economy which is heavily dependent on export, especially the materials and intermediate products that are used in producing goods sold to US. The escalation of trade tension is helping improve China-Japan’s trading relationship. Japanese Yen gained some recovery as China’s central bank pledged to keep the yuan “generally stable at a reasonable level”. The US-China tariffs will be imposed on June 6th, Japanese Yen would likely to remain well bid given its safe-haven characteristics. The U.S ISM Manufacturing PMI surged to 60.2 in June, above the estimate of 58.2 points. Private enrollment data and non-manufacturing data will be released later this week, providing insight on whether US economy is able to maintain its current strong growth.
 GBP/EUR Price Chart: 5-minute Timeframe (from June 27 to July 4, 2018). Source: Tradeview.com
The pound slumped to a seven-month low and closed at 1.1304 on Friday as Bank of England Deputy Governor Jon Cunliffe expressed worries about the household debt and concerns over Brexit weighed. The GBP/EUR moved steadily this week thanks to “better-than-forecast UK construction data and worse-than-expected Eurozone retail sales figures”. UK’s construction sector PMI rose from 52.5 to 53.1, beating the market estimate of 0.1 decline. Trade wars appear to have less impact on UK economy than initially expected. The Brexit process also seems to have been going on smoothly. The UK’s White Paper on the exit from the European Union will be released on July 9th.
On June 25th, for the forecasting period of 7 days, I Know First Algorithm gave EUR/USD a signal of -2.58 with the predictability of 0.14, suggesting we expected this pair would fall and gave bullish view on dollar against Euro. The actual movement was -0.14%, which demonstrated our forecast. Our algorithm also successfully predicted EUR/GBP movement based on pattern recognition by providing a signal of 1.91 and a predictability of 0.20 and the actual movement was 0.76% in the forecasting time range.
 Algorithmic traders utilize these daily forecasts by the I Know First market prediction system as a tool to enhance portfolio performance, verify their own analysis and act on market opportunities faster. This forecast was sent to current I Know First subscribers.
How to interpret this diagram
Algorithmic Currency Forecast: The table on the left is the forex forecast for the forex outlook produced by I Know First’s algorithm. Each day, subscribers receive forecasts for six different time horizons. Note that the top 54 currencies in the 1-month forecast may be different than those in the 1-year forecast. In the included table, only the relevant currencies have been included. The boxes are arranged according to their respective signal and predictability values (see below for detailed definitions). A green box represents a positive forecast, suggesting a long position, while a red represents a negative forecast, suggesting a short position.
Forecast Performance: The table on the right compares the actual currency performance with I Know First’s prediction. The column titled “Forecast” shows which direction the algorithm predicted, and the column “% Change” shows the actual currency’s performance over the indicated time period. The “Accuracy” column shows a “v” if the algorithm correctly predicted the direction of the stock or an “x” if the forecast was incorrect. The “I Know First Hit Ratio” represents the algorithm’s accuracy when predicting the trend of the currency.
Signal: This indicator represents the predicted movement direction/trend; not a percentage or specific target price. The signal strength indicates how much the current price deviates from what the system considers an equilibrium or “fair” price.
Predictability: This value is obtained by calculating the correlation between the current prediction and the actual asset movement for each discrete time period. The algorithm then averages the results of all the prediction points, while giving more weight to recent performance. As the machine keeps learning, the values of P generally increase.
Please note-for trading decisions use the most recent forecast. Get today’s forecast and Top stock picks.


