Weekly Currency Review: Escalating Trade War Helps US Dollar Beat Others
Weekly Currency Review
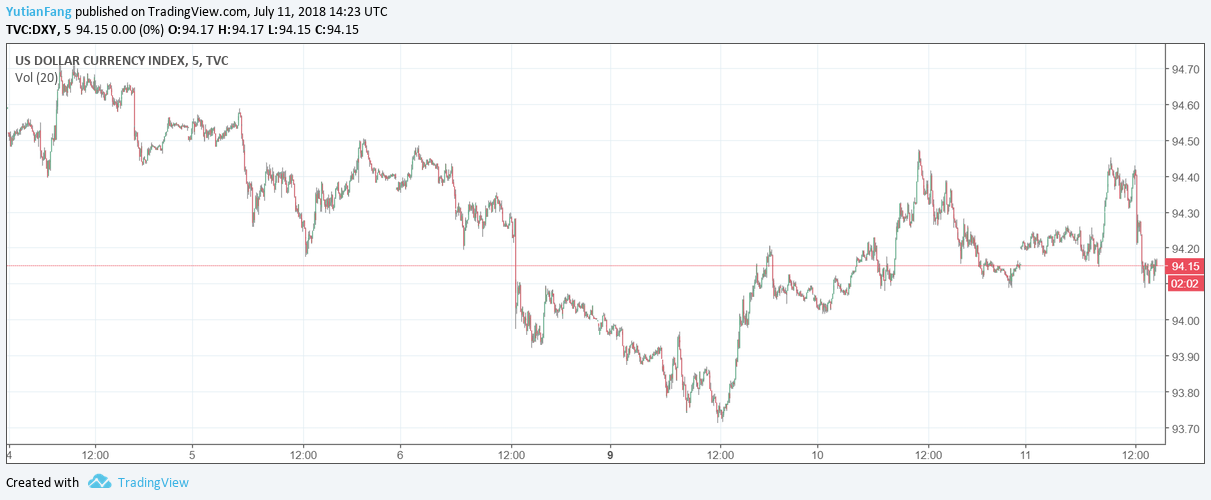
DXY Index Price Chart: 5-minute Timeframe (from July 4 to July 11, 2018). Source: Tradeview.com
The US employment data released last Friday showed optimism in the economy. There are 213,000 jobs added in June, down from the May’s figure of 244,000 but beating the forecast of 195,000 from Thomson Reuters survey. Even though slightly falling short of expectations, the wage growth also held steady from the previous month, achieving a year-over-year growth of 2.7% and a monthly increase of 0.2 per cent. However, the rise in the labor force participation drove the unemployment rate up to 4% and Average Hourly Earnings missed the estimates given the country’s strong inflation prospect. The trade battle is officially underway as the US’s tariffs on $34 billion imports from China and Chinese retaliations took effect on Friday. Market concerned about the trade war may impact the companies’ investment and operations, which probably would go against Trump’s initiative to protect domestic manufacturers and hold back job gains. The US dollar pulled back against all of its major counterparts with the DXY dropping down to 93.81 on Monday and is trading below 94.00 since the start of this week.
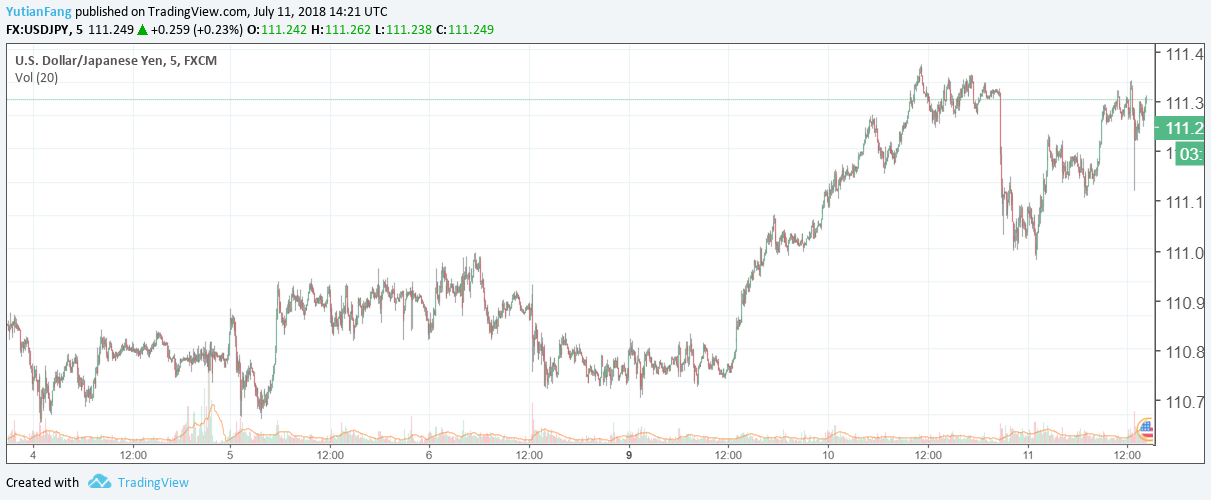 USD/JPY Price Chart: 5-minute Timeframe (from July 4 to July 11, 2018). Source: Tradeview.com
Supported by strong employment data and weak demand of Yen, US dollar rose to near a six-month high of 111.355 against Japanese yen on Tuesday until additional 10% on $200 billion Chinese goods were unveiled and the risk-off sentiment underpinned the Yen’s safe-haven appeal. The pair then dropped and closed at 110.85 on Tuesday. The Bank of Japan remains optimistic that “Japan’s economy is expected to continue expanding moderately” based on the positive outlook of Japanese exports and confidence on inflation reaching to the target level. On the US side, the upcoming CPI figure would possibly prompt the Fed to speed up the course to raise interest rates.
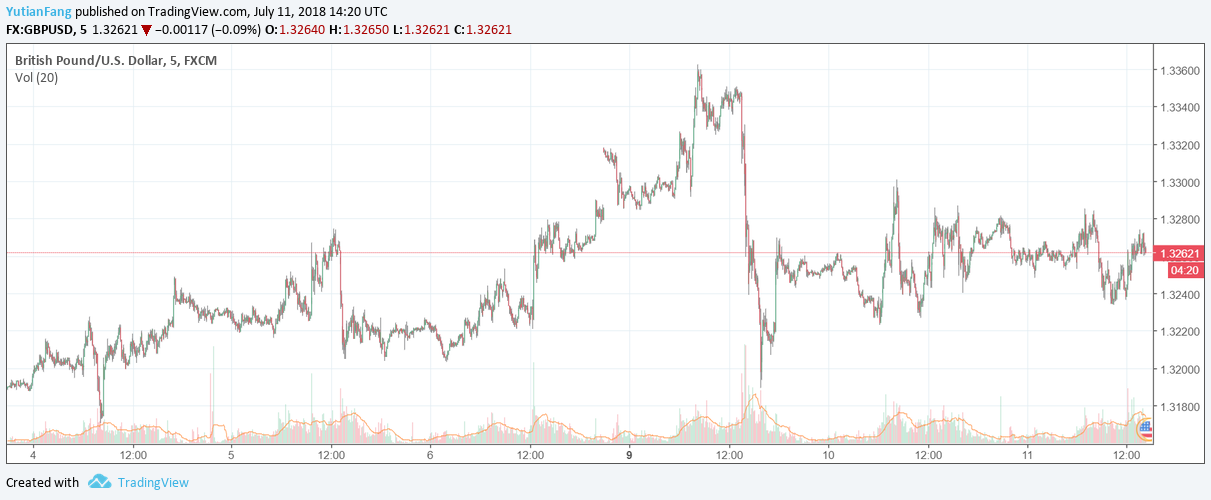 GBP/USD Price Chart: 5-minute Timeframe (from July 4 to July 11, 2018). Source: Tradeview.com
The British pound continued its climbing against the dollar until the GBP/USD pair slumped on Monday when two ministers resigned over Theresa May’s Brexit plans, where UK agrees to maintain current customs arrangement for manufacturing and agricultural products after Brexit. On the release front, after three monthly consecutive declines, British manufacturing Production achieved a growth of 0.4%. The Britain’s trade data also showed improvement with the number narrowing to GBP 12.4 billion. The NIESR’s estimate for GDP in Q2 gave a sign that the country is recovering from the slowdown in the first quarter. In the short term, the potential US renewed tariffs still remain a risky factor that makes the market sentiment swing to downside.
 AUD/USD Price Chart: 5-minute Timeframe (from July 4 to July 11, 2018). Source: Tradeview.com
Recently released Australian economic data showed a strong prospect. The Westpac Consumer Confidence achieved a largest monthly jump of 3.9% since May 2016. The home loans revered the decline in the past six months and rebounded in May. However, the positive data seem to be ignored by the market amid the trade tensions. Following the Trump administration’s statement about the additional tariffs, China stated that it will be forced to retaliate. On Monday, the Australian dollar tumbled to the lowest level since January 2017 and the downside momentum of AUD/USD pair is still growing. For the foreseeable future, with the global economy keep growing and other central banks raising interest rates, the appeal of Australian dollars will fade away given that the current environment would make the expectation for rising Australian interest rates dimmed.
 USD/ARS Price Chart: 30-minute Timeframe (from June 10 to July 10, 2018). Source: Tradeview.com
On June 10th, I Know First issued 1 month forecast for the currencies. During the prediction period, I Know First Algorithm caught monthly returns up to 8.01%, the pair we predicted with a strong signal of 77.86 and predictability of 0.35. We also gave GBP/USD a signal of -16.48 with the predictability of 0.44, suggesting we have strong confidence that this pair would fall and gave bullish view on dollar against pound. The actual movement was -1.01%, which mirrored our forecast. Our algorithm also successfully predicted AUD/USD movement based on algorithms by providing a signal of -2.92 and a predictability of 0.39. The actual movement of this pair was -1.86% in the forecasting time period.
Algorithmic traders utilize these daily forecasts by the I Know First market prediction system as a tool to enhance portfolio performance, verify their own analysis and act on market opportunities faster. This forecast was sent to current I Know First subscribers.
How to interpret this diagram
Algorithmic Currency Forecast: The table on the left is the forex forecast for the forex outlook produced by I Know First’s algorithm. Each day, subscribers receive forecasts for six different time horizons. Note that the top 54 currencies in the 1-month forecast may be different than those in the 1-year forecast. In the included table, only the relevant currencies have been included. The boxes are arranged according to their respective signal and predictability values (see below for detailed definitions). A green box represents a positive forecast, suggesting a long position, while a red represents a negative forecast, suggesting a short position.
Forecast Performance: The table on the right compares the actual currency performance with I Know First’s prediction. The column titled “Forecast” shows which direction the algorithm predicted, and the column “% Change” shows the actual currency’s performance over the indicated time period. The “Accuracy” column shows a “v” if the algorithm correctly predicted the direction of the stock or an “x” if the forecast was incorrect. The “I Know First Hit Ratio” represents the algorithm’s accuracy when predicting the trend of the currency.
Signal: This indicator represents the predicted movement direction/trend; not a percentage or specific target price. The signal strength indicates how much the current price deviates from what the system considers an equilibrium or “fair” price.
Predictability: This value is obtained by calculating the correlation between the current prediction and the actual asset movement for each discrete time period. The algorithm then averages the results of all the prediction points, while giving more weight to recent performance. As the machine keeps learning, the values of P generally increase.
Please note-for trading decisions use the most recent forecast. Get today’s forecast and Top stock picks.


