I Know First Evaluation Report for Short-Term Currencies
Executive Summary
In this forecast evaluation report, we will examine the performance of the forecasts generated by the I Know First AI Algorithm for the currency market with short term time horizons ranging from 1 to 6 days, which were delivered daily to our institutional clients. Our analysis covers the time period from 28 March 2019 to 9 June 2019. Below, we present our key takeaways from applying signal and volatility filters to pick the best performing currency pairs:


Currencies Highlights:
- Top 5 currency pairs without volatility adjusted had better returns in the 1- and 2-day time horizons, providing an average return of 0.19% in the 1 day horizon which outperformed the benchmark by 1800%.
- Top 5 currency pairs with volatility adjusted outperformed the benchmark in all time horizons, providing the highest return of 0.19% in 6 days.
Note that the above results were obtained as a result of evaluation conducted over the specific time period and using a sample approach of consecutive filtering by predictability and by signal indicators to give a general presentation of the forecast performance patterns for specific currency pairs. The following report provides extensive explanation on our methodology and detailed analysis of the performance metrics that we obtained during the evaluation. This report is a new I Know First evaluation series illustrating the ability to provide successful short term and flexible forecasting for the currency market.
About the I Know First Algorithm

The I Know First self-learning algorithm analyses, models, and predicts the capital market, including stocks, bonds, currencies, commodities and interest rates. The algorithm is based on Artificial Intelligence (AI) and Machine Learning (ML) and incorporates elements of Artificial Neural Networks and Genetic Algorithms.
The system outputs the predicted trend as a number, positive or negative, along with a wave chart that predicts how the waves will overlap with the predicted trend. Consequently, the trader can decide which direction to trade, when to enter the trade, and when to exit the trade. The model is 100% empirical, based only on factual data, thereby avoiding any biases or emotions that may accompany human assumptions. I Know First’s model only involves the human factor is building the mathematical framework and providing the initial set of inputs and outputs to the system. The algorithm produces a forecast with a signal and a predictability indicator. The signal is the number in the middle of the box. The predictability is the number at the bottom of the box. At the top, a specific asset is identified. This format is consistent across all predictions.
Our algorithm provides two independent indicators for each asset – signal and predictability.
The signal is the predicted strength and direction of movement of the asset. This is measured from -inf to +inf.
The predictability indicates our confidence in the signal. The predictability is a Pearson correlation coefficient relating past algorithmic performance and actual market movement, measured from -1 to 1.
You can find a detailed description of our heatmap here.
The Currency Picking Method
The method in this evaluation is as follows:
To fully utilise information provided by our forecast, we filter out the top 30 most predictable currencies and rank them according to their predictability value. Next, we pick the top 10 highest signals from the ranked currencies.
By doing so, we focus on both the most predictable currency pairs and still capture the highest signa pairs.
The Performance Evaluation Method
We perform evaluations on the individual forecast level. This means that we calculate the return of each forecast we have issued for each horizon in the testing period. We then take the average of those results based on our positions on different currencies and forecast horizon.
For example, to evaluate the performance of our 1-month forecasts, we calculate the return of each trade by using this formula:
This simulates a client buying a currency on the day we issue our prediction and selling it exactly 1 month in the future from that day.
We iterate this calculation for all trading days in the analysed period and average the results.
The Hit Ratio Calculation
The hit ratio helps us to identify the accuracy of our algorithm’s predictions.
Using our currency filtering method based on predictability and signal, we predict the direction of movement of different currencies. Our predictions are then compared against actual movements of these currencies within the same time horizon.
The hit ratio is then calculated as follows:

For instance, a 90% hit ratio for a top 30 predictability filter with a top 10 signal filter would imply that the algorithm correctly predicted the price movements of 9 out of 10 currencies within this particular set of currencies.
The Benchmarking Method
The theory behind our benchmarking method is the “Null hypothesis“. This means buying every currency in the particular currency universe regardless of our I Know First indicators. For instance, if we were to identify the top 10 currency pairs from the currencies universe of 52 currency pairs, we would calculate the rate of return of 52 currency pairs, where an equal amount of each currency pair would be bought at the start of the time horizon and sold at the end of the time horizon. This helps us to determine the effectiveness of our predictability-based currency filtering process by comparing the rate of returns of the benchmark with the rate of return of our predictability-based strategy.
Universe Under Consideration: Currencies
In this report, we conduct testing for the 52 currencies pairs covered by I Know First in the “Currencies” package. This package includes the major worldwide traded currency pairs, such as USD/EUR, USD/GBP, etc.
Performance Short Term Model Evaluation
We conduct our research for the period from 28 March 2019 to 9 June 2019. Following the methodology from the previous sections, we start our analysis by computing the performance of the algorithm’s short-term signals for time horizons ranging from 1 day to 6 days. Afterwards, we calculate the returns for the same time horizons for the benchmark using the currencies universe and compare it against the performance of the filtered sets of currency pairs.
It is also important to measure the outperformance relative to the benchmark and for that we will apply the formula:

Overall, we applied filtering by signal strength to the Top 30 currencies pairs, after filtering previously by predictability. In addition, we applied volatility adjustments to have different signals and therefore different subsets. We present our findings in the following sections.
1. Evaluating the Signal Indicator without Volatility Adjustment
In this section, we present our results only filtering by signal strength, without using volatility adjustment. The next tables show the average returns of the subsets in different time horizons. We evaluate the 1 to 6 day timeframes.


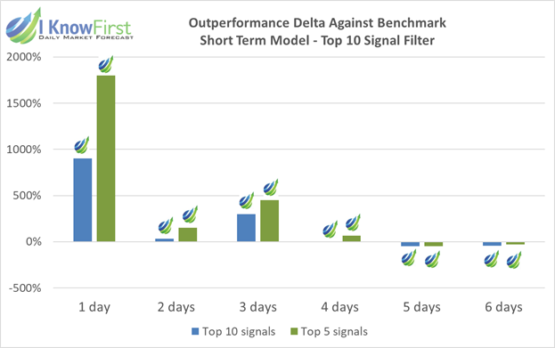
From the above set of charts, we can see both subsets, Top 5 and Top 10 signals, have significantly greater returns than the benchmark in 1-, 2- and 3-days’ time horizons. The better out-performance is observed in the 1-day’ period, and from there the out-performance decreases as the time horizon increases. The highest return was produced by the Top 5 currency pairs with 0.19% of the return at the 1-day’ time horizon. Finally, the Top 5 and Top 10 subsets were under the benchmark’s return in 5- and 6-days’ periods.
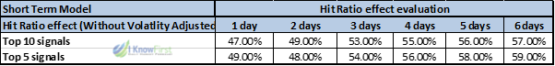

For the Hit Ratio performance, both subsets have similar results in each time horizon. The hit ratio doesn’t show a clear effect of the signals but increases as the time horizon increases.
2. Evaluating the Signal Indicator with Volatility Adjustment
In this section, we present our results filtering by signal strength and using volatility adjustment for filtering by signal strength. The following tables show the average return of the subsets in different time horizons. We evaluate the 1 to 6 day timeframes.

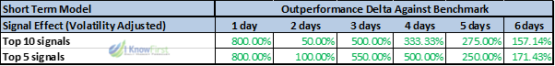
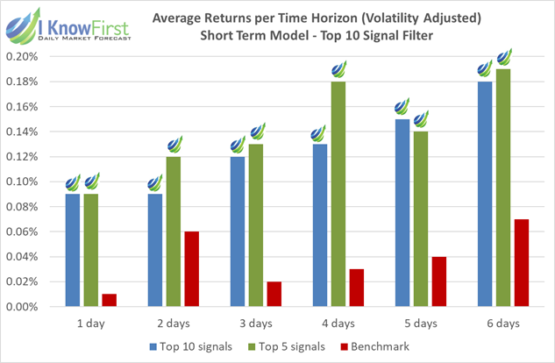

From the above set of charts, we can see both subsets, Top 5 and Top 10, produce greater returns than the benchmark in all timeframes. At the same time, we observe that returns increase as we consider a longer time horizon, with the Top 5 subset producing 0.19% return in a 6-day’ period. In almost every timeframe, the outperformance is at least 100%, so returns were at least double that of the benchmark.
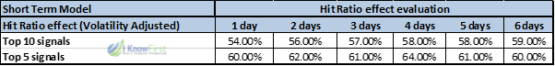
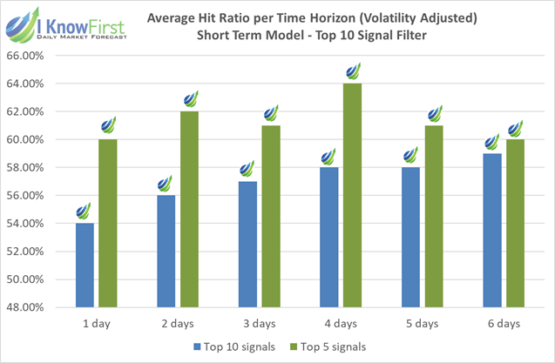
The hit ratio performance for the Top 10 subset has a positive trend as the time horizon increases. For the Top 5 subset, the hit ratio is always over 60%.
3. Comparison results without volatility adjustment and with volatility adjustment
The Top 5 signals subset obtained higher returns both with and without the volatility adjustment. The following chart shows the return of the adjusted and unadjusted subsets in different time periods.


For the Top 5 currency pairs without volatility adjusted, we note better performance than the Top 5 with volatility adjusted for the 1- and 2-days’ time horizons. Most notably, we observe that for 1 day horizon, the subset without volatility adjusted provides returns of 0.19%, which is 1800% better than the benchmark. When we observe the volatility adjusted Top 5 currency pairs, we find better performance for 4-, 5- and 6-days’ time horizons, outperforming the benchmark for 500% in the 4-day period.
Conclusion
In this analysis, we demonstrated the out-performance of our forecasts for the Top 10 currency pairs picked by I Know First’s AI Algorithm during the period from 28 March 2019 to 9 June 2019. Based on the presented observations, we record significant out-performance of the Top 5 currencies pairs when our signal indicators are used as an investment criterion. As shown in the above diagram, the Top 5 currencies pairs without volatility adjusted yield significantly higher return on the 1- and 2-days’ time horizons. Furthermore, we also note that for 4-, 5- and 6-days’ periods, the Top 5 volatility adjusted currency pairs outperform the currency pairs without volatility adjusted, whereas the Top 5 currency pairs without volatility adjusted may be preferable for time horizons of 1 day to 2 days.


